Driving impact through data at Special Olympics Pennsylvania
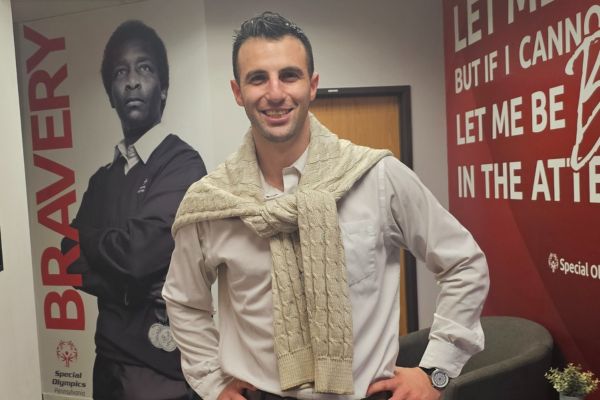
Jason Woolf at the Special Olympics Pennsylvania (SOPA) office. Photo credit: Jason Woolf
With support from the Social Impact Internship Fund (SIIF) of the Cornell SC Johnson College of Business, I accepted a summer internship with Special Olympics Pennsylvania (SOPA), reporting directly to the CEO in the design of an actionable, data‑driven urban growth strategy aimed at doubling athletes while maximizing mission‑aligned impact.
Hitting the ground running: A powerful day‑1 insight
My first day began with a one-on-one meeting with CEO Matt Aaron. We picked up the SOPA case where my interview left off, and the objective sounded deceptively simple: What should SOPA do to double its number of athletes to roughly 30,000?
Later that day, during a senior leadership call, I learned something striking — bowling is SOPA’s most popular sport, yet it is also one of its least mission-aligned, given its limited health benefits.
I pointed out this tension, “If your goal is purely to grow athlete numbers and your customers love bowling, then SOPA should just give them more bowling. But if your mission is to maximize health outcomes, that’s a different playbook.”
“Not bad for Day 1,” Aaron replied.
That exchange set the tone for the summer, balancing growth with purpose and using data to illuminate trade-offs rather than jumping to easy answers.
Building the case: Context, constraints, and goals
Over the next several weeks, through engagement with leadership, datasets, and field insights, I built a consulting‑style case handbook to frame the problem and articulate objectives.
Here is the snapshot we were working with:
- 15,000 athletes with intellectual disabilities (ID) competed in 21 sports across 537 training sites, supported by more than 14,000 volunteers.
- Full-time staff had nearly tripled to about 75 over five years as part of a regionalization and scale‑up effort, but athlete participation did not keep pace, falling from about 19,000 in 2019 to about 15,000 today.
- SOPA reaches only about 3.2% of Pennsylvania’s ID population — well below peer states, which reach about 10%.
The 2026–30 strategic plan was bold:
- Double athletes to 30,000.
- Expand training sites to within a 45‑minute drive of every ID resident.
- Grow annual revenue from $13.8 million (2025) to $21 million (2030).
Our challenge: How can SOPA achieve this growth while balancing costs, fundraising capacity, volunteer power, and its mission pillars of health, inclusion, and service excellence?
“Impact revenue”: Making trade‑offs visible
One of my proudest contributions was introducing the concept of “impact revenue.” Although SOPA is a nonprofit, leaders often used subscription business terms like customers, customer acquisition cost (CAC), churn, and customer lifetime value (CLV). I proposed a parallel metric — “impact bucks” — an imaginary currency to measure the health, inclusion, and skill development generated per hour of athlete participation.
By assigning an impact price per participation hour by sport, we could compare apples to apples.
A simplified example captured the core tension:
Option 1: Bowling — Launch five bowling sites; 30 athletes participate one hour per week on average at each site; each is assigned $5 in impact bucks per hour.
5 sites x 30 athletes x 1 hour/week x $5 = $750 in impact revenue per week (150 athletes)
Option 2: Soccer — Launch three soccer sites; 20 athletes participate for three hours per week on average; each is assigned $9 in impact bucks per hour.
3 sites x 20 athletes x 3 hours/week x $9 = $1,620 in impact revenue per week (60 athletes)
Option 2 generates more than twice the impact, but Option 1 reached 2.5 times more athletes. When I presented this to Aaron, he made the strategic preference explicit: optimize for “good growth” (impact revenue), not growth for growth’s sake.
The summer games: Where data meets purpose
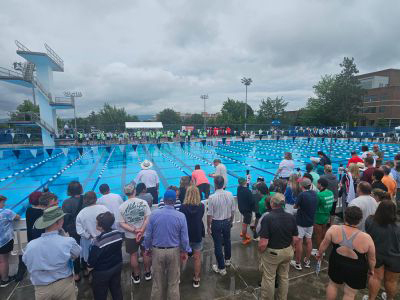
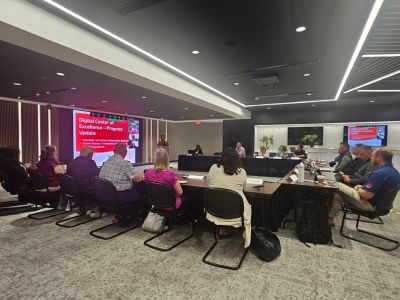
In midsummer, I traveled to Penn State University for the Special Olympics Pennsylvania Summer Games. With a fellow MBA intern from Dartmouth Tuck (anonymized here as “Cindy”), I volunteered, met families and coaches, and observed a quarterly board meeting where regional leaders presented athlete and fundraising growth strategies.
Watching the parade of athletes through the opening ceremony at Medlar Field, hearing their oaths, seeing the Flames of Hope ignite, it hit me that every late‑night business analytics model, every painful data clean, every churn‑rate calculation was about creating more of these moments for more people.
That’s when impact became tangible.
The big consulting project: Urban penetration strategy
Back in the office, Cindy and I were assigned a major project: designing data-driven urban penetration strategies for Philadelphia and Pittsburgh, SOPA’s largest markets. I led the analytics workstreams, tackling questions including:
- Which sports promise the greatest athlete impact in each city?
- What participation and growth should SOPA expect by sport?
- Which sports are co‑enrolled together (correlations across rosters)?
- Which sports have the lowest cost to launch and operate?
It was my first real build in Power BI, Microsoft’s business analytics platform, and Power Query, a data preparation tool. It was a steep learning curve that demanded long nights as deadlines approached. But the earlier case handbook kept me oriented — I knew which questions mattered and what metrics (e.g., CAC, churn rate, impact revenue, and impact CLV) would translate analysis into decisions. When we presented to leadership, the reception was energizing. The trade‑offs were clearer, the recommendations actionable, and the path to “good growth” more concrete.
Lessons learned: Leadership and purpose
SOPA brought in MBA interns not to crunch numbers in isolation, but to inject fresh perspective, smart frameworks, and analytical rigor into the 2026 –30 strategic plan. This gave us room to think like consultants, owning problems end-to-end while still staying close to the heart of the organization.
I learned that earning trust isn’t about having all the answers. Rather, it’s about asking the right questions, simplifying complexity, and staying focused on impact.
The largest reward was seeing the immediate connection between structured analysis and lives improved. If our work helps thousands of Pennsylvanians with intellectual disabilities become more active, more connected, and healthier in the coming years, then the return on this internship, thanks to Johnson’s Social Impact Internship Fund, is immeasurable.
About the author

Jason Woolf is an MBA candidate in the Cornell Samuel Curtis Johnson Graduate School of Management, spending his second year at Cornell Tech in New York City, where he’s focused on venture building and financing within emerging markets, particularly Africa. This comes on the back of a decade of entrepreneurship in Cape Town, South Africa (NGO development, tour operations, film), where his commitment to Global South development was built. Having recently completed two MBA internships — strategy and data analysis for Special Olympics Pennsylvania ($14 million budget) and capital raising for the Launch Africa Ventures ($60 million AUM; 162 ventures) — he is eager to work in areas such as capital introduction, impact venture capital, venture philanthropy, and social impact consulting.