The 2010s: A decade in review for emerging markets

This year we celebrate the 10th anniversary of Johnson’s Emerging Markets Institute. Now that we move into the 2020s, it is important to look back over this past decade to better understand how the landscape of emerging markets has changed and what may lie ahead.
Emerging Markets in a Decade of Transition
The term emerging market can be used to describe a nation’s economy that is in the process of becoming more engaged with global financial and political systems. These markets traditionally evolve from having few multinational corporations and a low-to-mid per capita income towards ones that embody a more industrialized economy and higher standards of living. Other characteristics of emerging markets (EMs) include low levels of liquidity, commodity and currency swings, high market volatility and more.
MSCI EM Index countries represented 44.2% of the world’s nominal GDP as of the end of 2018. The total market capitalization of the MSCI EM Index’s 1,401 large and small cap constituents was USD $5.62 trillion as of the end of February 2020. The four largest emerging markets by either nominal or PPP-adjusted GDP are known as BRIC countries (Brazil, Russia, India and China). However, not all EMs are equal in size and scope as some have grown much faster and more consistently than others. Among all EMs over the past decade one country stands out: China.
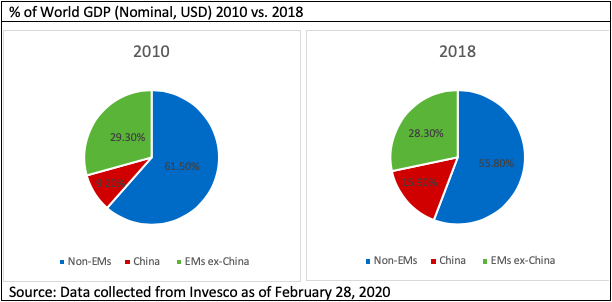
From 1978 (the start of China’s Open Door Policy) to 2018, China’s annualized GDP growth rate was an unparalleled 9.5%. China’s GDP has been rapidly closing the gap with the U.S. since 2010 and is now larger than the GDP of Africa, India, Russia, and all of Latin America combined. Along with the U.S., China generated the majority of worldwide growth during the 2010s. While EMs’ percent of world nominal GDP increased from 38.5% in 2010 to 44.2% in 2018, most of this growth came from China. China’s share of world nominal GDP increased from 9.2% to 15.9% while its 25 EM counterparts collectively decreased their share from 29.3% to 28.3% during this time. China should thus be viewed as an anomaly with respect to other EMs due to the magnitude of its size and growth. In order to better understand the past decade and what may lie ahead for EMs, it is important to analyze their performance both within and without the context of China.
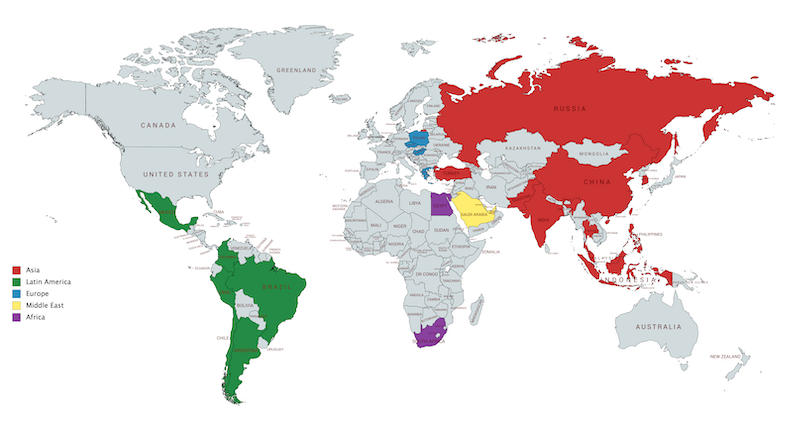
The Morgan Stanley Capital International (MSCI) Emerging Markets Index measures equity market performance in global EMs. The index captures mid and large caps in 26 countries that include Argentina, Brazil, Chile, China, Colombia, the Czech Republic, Egypt, Greece, Hungary, India, Indonesia, Korea, Malaysia, Mexico, Pakistan, Peru, the Philippines, Poland, Qatar, Russia, Saudi Arabia, South Africa, Taiwan, Thailand, Turkey and the United Arab Emirates.
The 2010s were Challenging for Emerging Markets
In the 2010s, EMs witnessed a series of macroeconomic and geopolitical events that brought volatility to their financial markets. Some of these events include the European sovereign debt crisis (2009-2019), the Arab Spring (2010-2012), a U.S. government credit downgrade (2011), negative interest rates introduced by the ECB (2014), the Brazilian economic crisis (2014-2017), the Russian financial crisis (2014–2017), the Chinese stock market crash (2015), the 2016 U.S. presidential election (2016), the Brexit vote (2016), flattening and inverted yield curves (2018 – 2019), the U.S.–China trade war (2018-2020), debt crises in Turkey and Argentina (2018-2020), and a wave of global protests (2019).
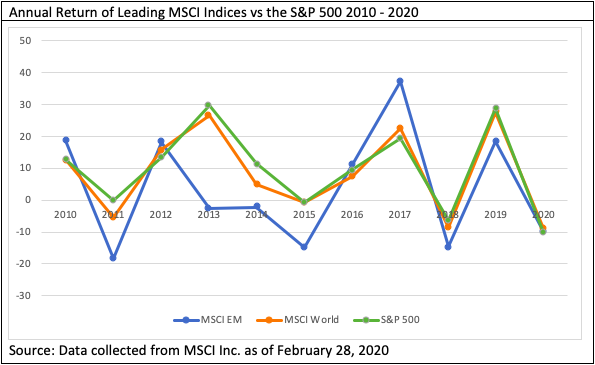
From January 1, 2000 to January 1, 2010, the MSCI EM index outperformed the S&P 500 by 11% on an annual basis, but underperformed it by 9.8% from January 1, 2010 to January 1, 2020. As of the end of 2018, EM equities represent 23% of worldwide capitalization, lower than their share 10 years ago. Two factors mainly drove the poor performance of EMs this past decade: (1) economic growth rates in EMs did not fully recover after the global financial crisis of 2008-2009 (2) the collapse of commodity prices in 2014-2015. Thus, the case for investing in EM equities should not solely be based on their superior macroeconomic growth.
Other factors may explain the weak performance of EMs over the 2010 decade:
- Slowdown of China’s Economy: Over the past decade, China’s nominal GDP annual growth rate slowed from 10.6% in 2010 to 6.1% in 2019. Reasons behind this change include China’s rapidly aging society – with 18% of its population aged 60 years or older, its debt-to-GDP ratio of 300% or USD $40 trillion, its weakening real estate and automobile sectors, and a build-up of excess capacity in iron and steel. China’s massive economy makes it an important metric in the performance of EMs as a whole.
- Marginalization of Latin American EMs: There are six emerging markets in Latin America (LatAm): Brazil, Mexico, Argentina, Columbia, Chile, and Peru. The economies of many of these countries derive substantial income from commodity trade. From 2009 to 2019, prices for items such as corn, coffee, soybeans, rice, and cocoa all declined. Based on nominal GDP figures, LatAm’s share among total EMs has fallen from 28% in 2010 to 13% in 2019. Other challenges faced by the LatAm EMs during this decade included low private sector investment and public sector infrastructure spending, insufficient domestic savings, and populism and nationalism inconsistent with economic policy.
- Stymied Trade Growth and Demand: Trade relations worsened in the latter half of the decade as the Japan–South Korea and U.S.–China trade disputes disrupted supply chains and slowed global manufacturing and production. Many EMs rely on thriving world trade to stimulate their economies by exporting commodities, low-end manufacturing products, and intermediate goods through global value chains. South Korea, for example, experienced a 7% year-on-year decline in exports in the first four months of 2019. Growth in global trade dropped to 1% last year, down from 4% in 2018 and 6% in 2017.
- Currency Depreciation Across EMs: The USD strengthened by 25% in the 2010s. This hurt EMs in three ways. First, EMs and emerging multinationals with high U.S. dollar-denominated borrowings, such as Turkey, Argentina, Mexico, Chile and Indonesia are placed in a tougher position to make loan repayments. Second, there is an inverse relation between the dollar and commodity prices. This decelerates real GDP growth in EMs that are net exporters of commodities. Lastly, a stronger dollar damages EMs through decreased capital flows as the dollar directs more capital away from EMs and towards U.S. assets. This can even force up interest rates and drain banking system liquidity in EMs.

1 Comment
Vinit Kr Khicha
A fantastic read that is factful and conceptual. Provides a clear perspective on how deeply the EM economies are intertwined with the developed ones!
Comments are closed.